Story Activities Dashboard
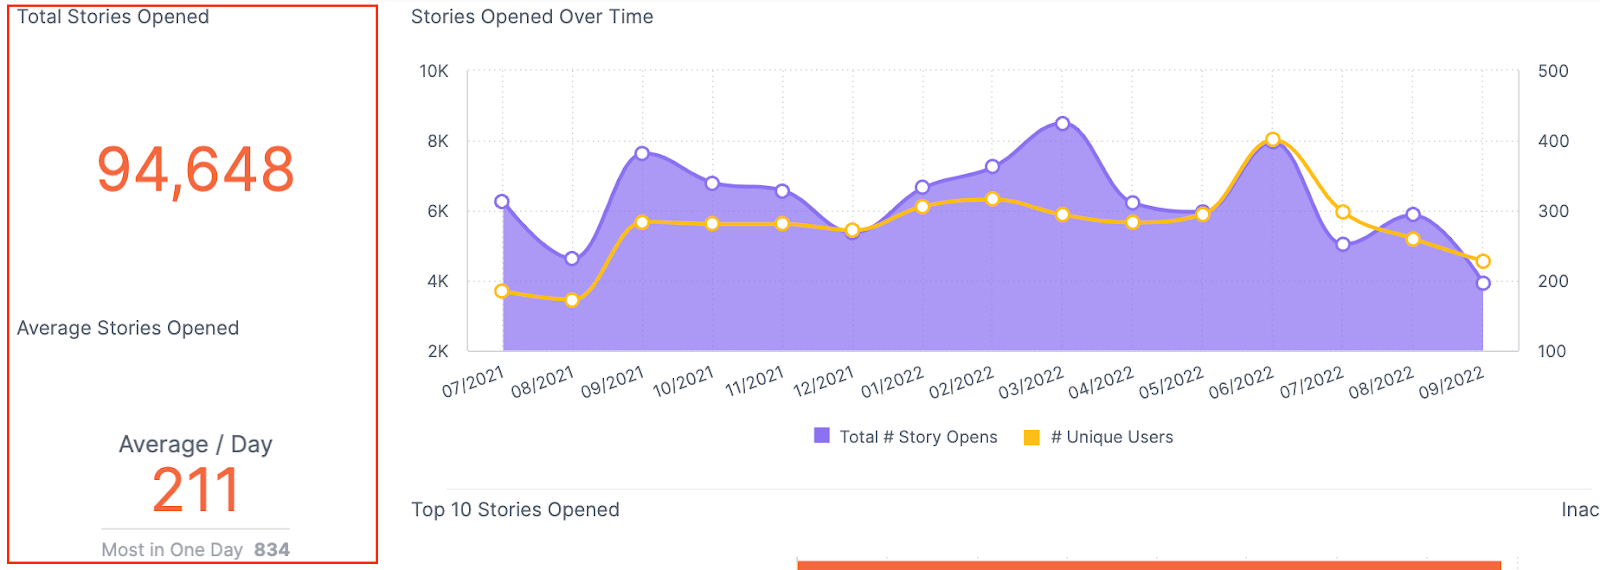
The ‘Total Stories’ widget indicates how many stories have been opened on the platform within the past year. While the ‘Average Stories Opened’ widget indicates the average amount of stories opened per day.
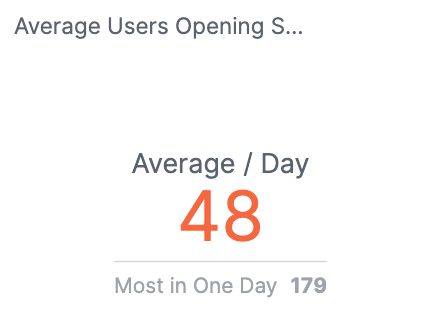
The ‘Average Users Opening Stories per day’ widget is the average number of users opening stories per each day. The widget also indicates the most users who opened stories in one given day.
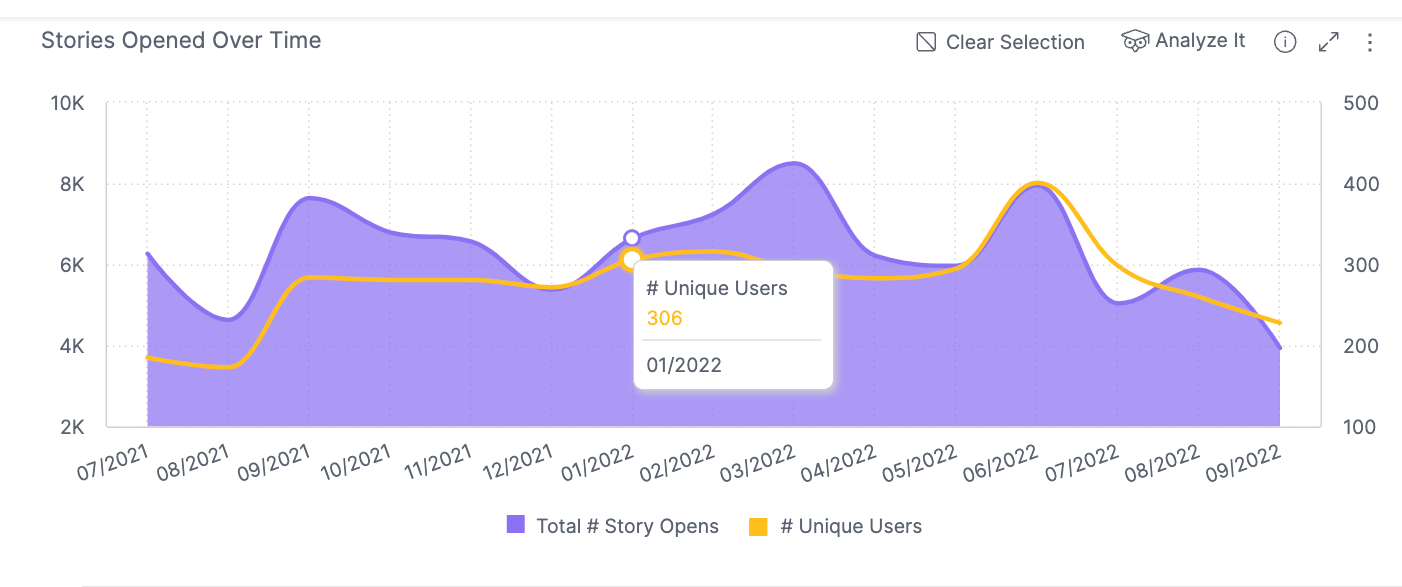
The ‘Stories Opened Over Time’ data map showcases a year's worth of data.
Clicking on data points on the map will filter the data on other widgets on the page. The total number of stories is represented on the left Y axis, while the total number of unique users is represented on the Y axis.
*Note: Turning off the ‘Last 365 days’ filter will bring in all of the data since Jan 2020

The ‘Other Story Stats’ widget showcases story stats that are driven by the data.
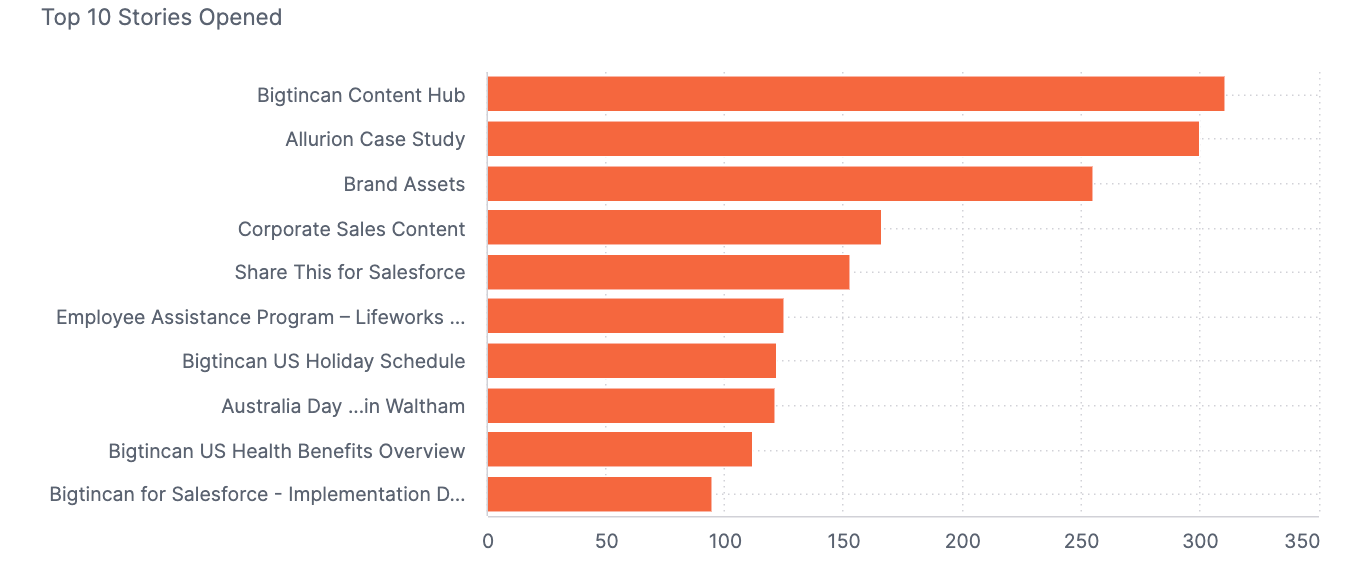
The ‘Top 10 Stories Opened’ widget is the top 10 stories opened ranked by how many opens each story has.
*Note: Clicking on a story title will filter the rest of the widgets.
The ‘Inactive Stories’ widget lists currently published stories that have never been opened or have the least amount of activity.
Comments
0 comments