Overview of Inner Joins
A common complication administrators face when examining related groups of data comes from a concept called an “Inner Join”
An Inner Join refers to the crossover when discussing two related pieces of data reported in Bigtincan Analytics. For example, Number of Users, and Number of Groups, are connected through the Inner Join of Group Members.

The Inner Join can cause confusion when examining totals in Pivot Tables.
Bigtincan Content Hub Analytics can accurately present information through Pivot Tables, if generated with particular specs designated.
Overview of Activity Analytic Dashboard

-
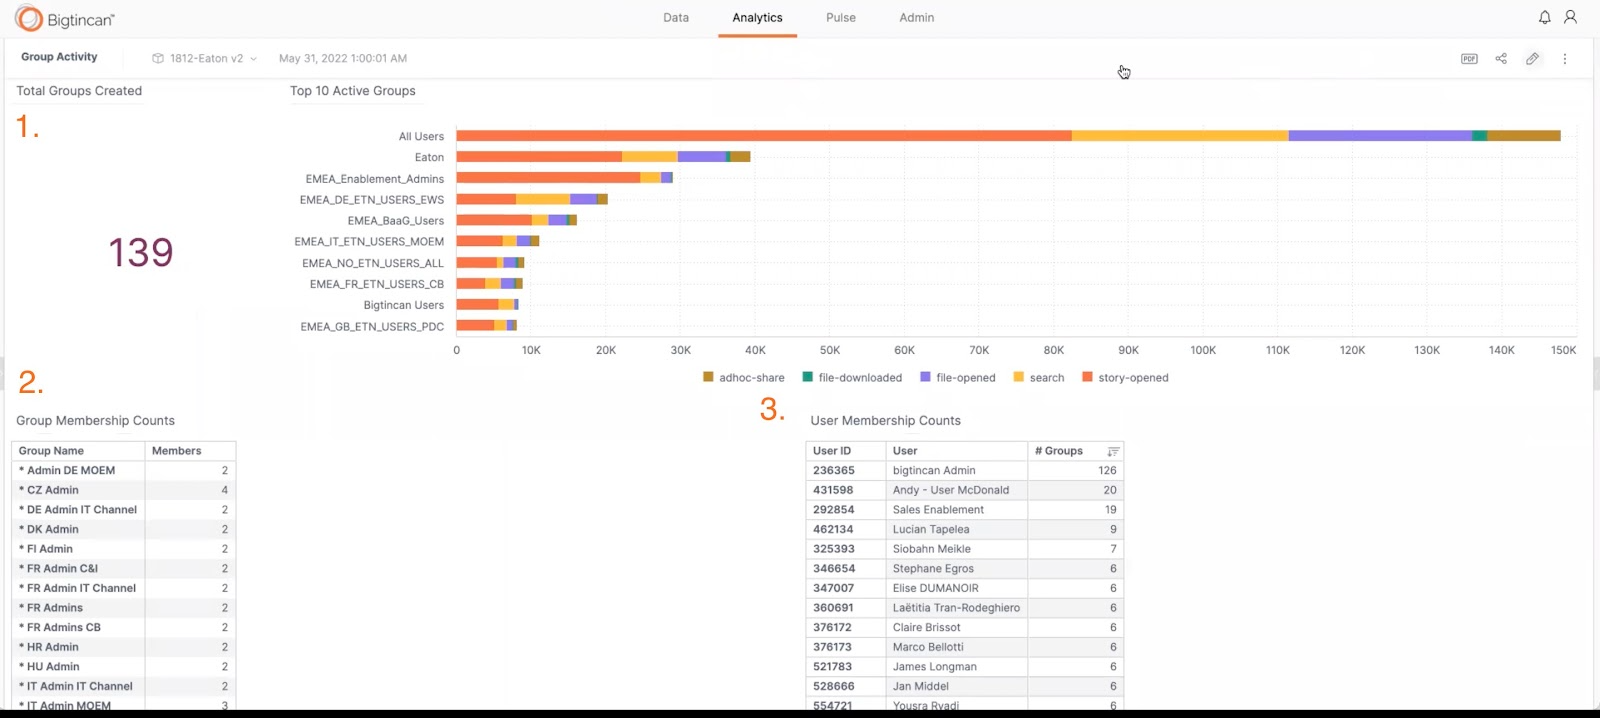
Total Number of “Groups Created”
-
Total Number of Groups created in the Content Hub
-
-
Group Membership Counts Pivot Table
-
An itemized list of groups with number of members
-
-
User Membership Counts Pivot Table
-
An itemized list of Users and how many groups to which they belong
-
The Pivot Table Problem
A Pivot Table is a powerful data summarization tool that can automatically sort, count, and sum up data stored in tables and display the summarized data. While this tool serves as an important asset in analyzing the data, some slight confusion arises. If certain aspects are not properly set, you will find some numerical discrepancies.
Example of Discrepancy in the Pivot Tables
Issue: In this example, we will display why the “Group Membership Counts,” a value displayed in one of the Pivot Tables, differ from the Total Number of Groups.
Expected Outcome: These values are expected to match.
Checking Total Groups Created Accuracy

-
The total number of Groups is 139 as seen in the above image. This is displayed on the dashboard.
-
The total number of Group Membership is 134, as seen in the total listed under the Group Membership Pivot Table:

-
To understand the source of discrepancy, we will examine both the Total Number of Groups Created Widget and the Group Membership Pivot Table Widget.
-
Select the “Edit Widget” option represented by a pencil icon in the upper right corner of the Groups Created Widget.
-
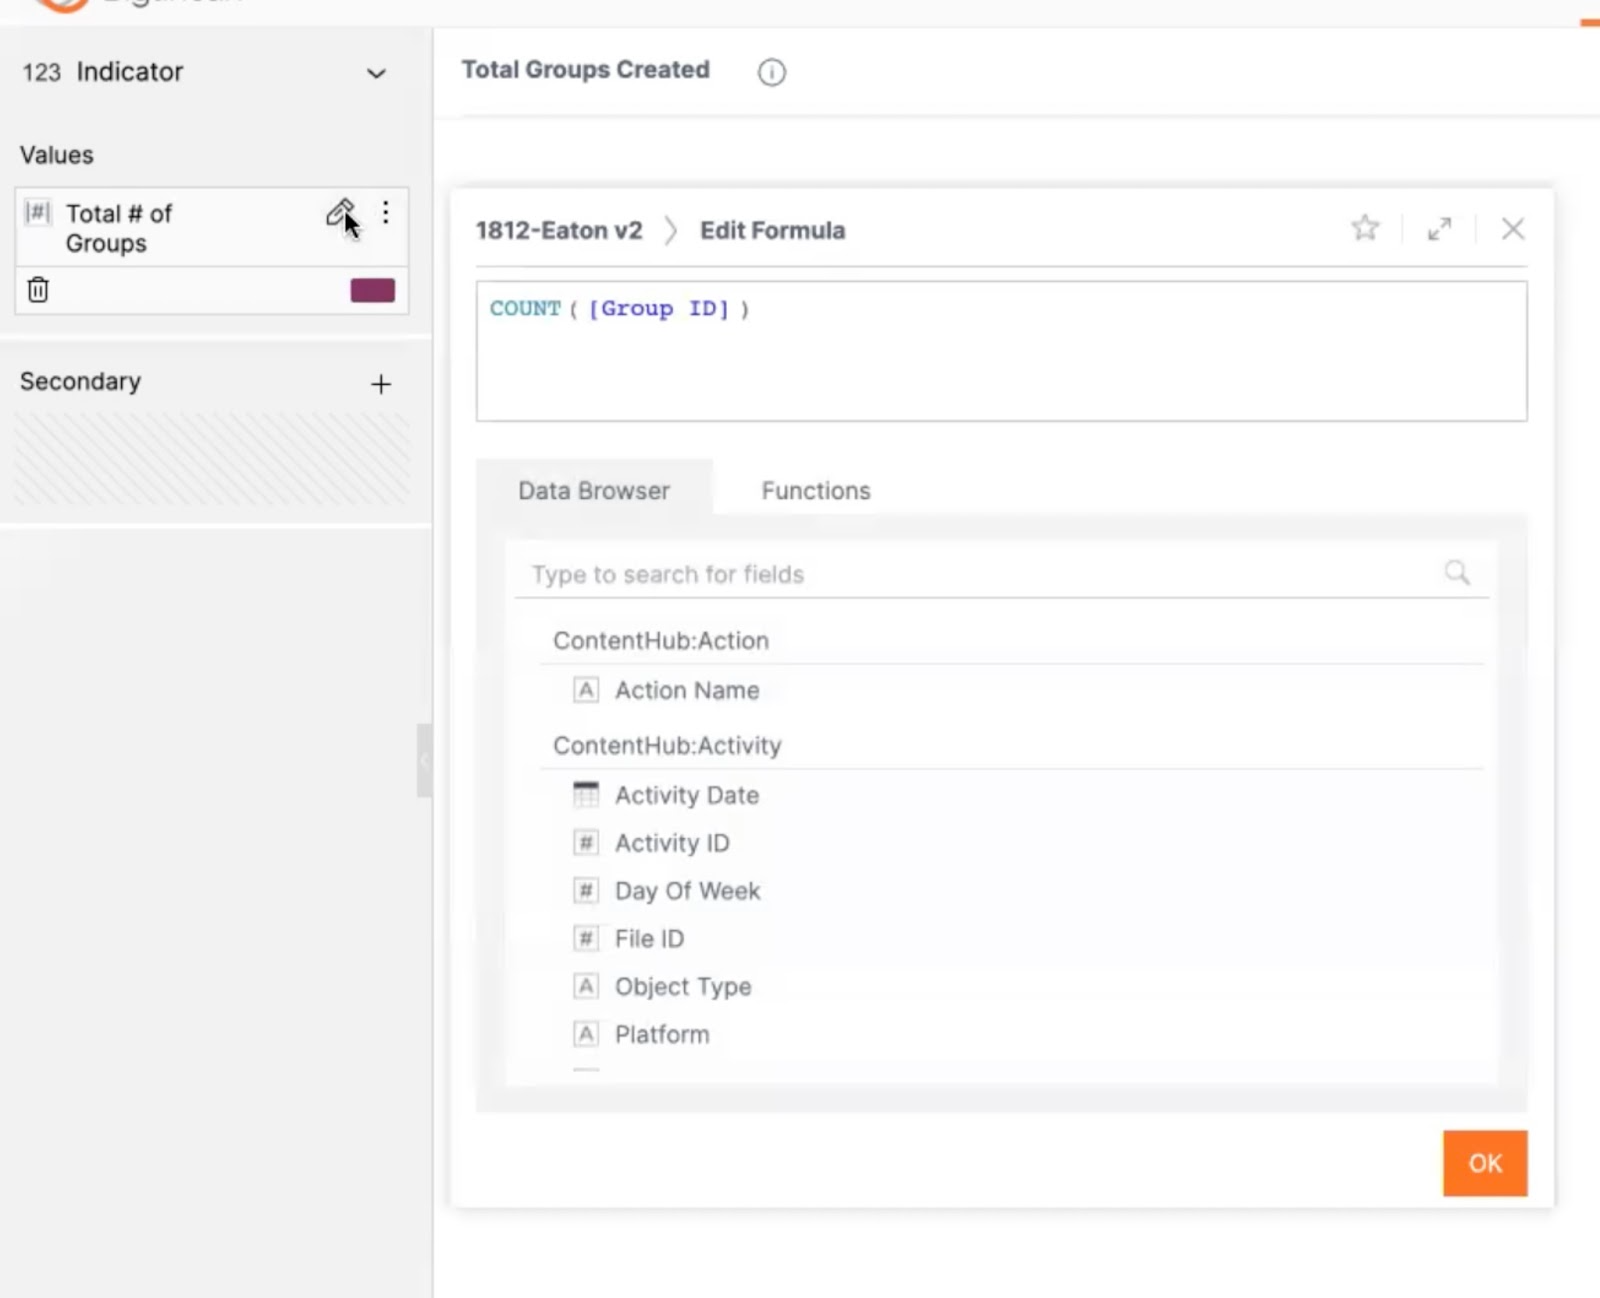
You will be directed to a editor page similar to the following:

This Image displays the editing page for Total Number of Groups Display Widget, as seen in the Values title. -
Notice the action displayed:

The number displayed in this Widget includes all unique group ID numbers. Because of this, we can be sure the 139 displayed in this widget is correct.
Adjusting your Pivot Table to Accurately Display Values
-
Once verifying the Total Number of Groups Created Widget, you can check the The Group Membership Pivot Table.
-
Select the Edit Widget option in the upper right corner of the Group Membership Pivot Table Widget
-
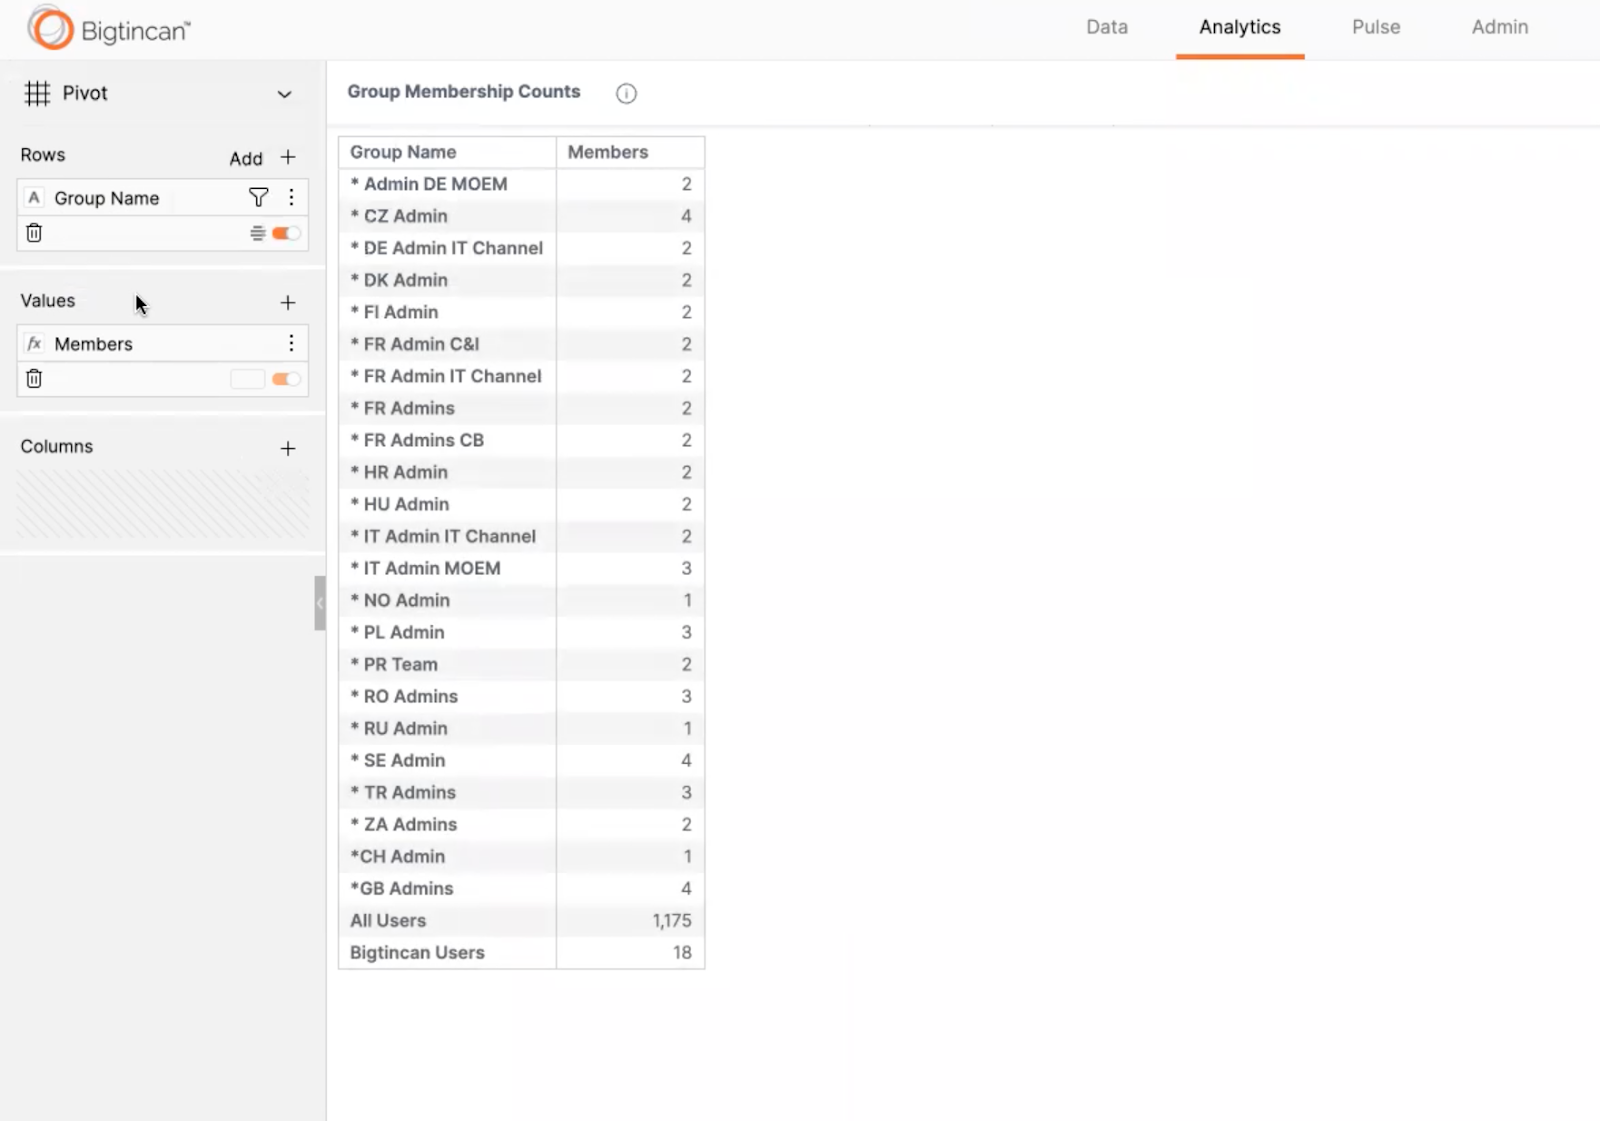
You will see an Editor Page similar to the following:

Notice, there are two values being displayed in the table:-
Group Name
-
Members
-
These are the two values the Pivot Table pulls from to collect that Inner Join Value. Because the table is pulling from that crossover value in the Venn Diagram (seen above) the total number will exclude the values falling outside that crossover!
-
Because this Inner Join discriminates towards certain values, we will add a customized action to ensure every line item is listed, not just the ones that appear in both groups.
-
Select the Second listed value, in this case we are selecting “Members.”
-
Delete the existing action
-
Here, we will generate and input a formula that will ensure the all line items are listed, not just the Inner Join.
Creating a Non discriminant Pivot Table
-
SUM ( [ID from the first value])
-
(SUM ( [ID from the first value]) - SUM ( [ID from the first value]))
-
(SUM ( [ID from the first value]) - SUM ( [ID from the first value])) + Browse through the options and find the appropriate data for your 2nd value
-
Your finalized equation will look similar to this:

Once applied, your values in the Pivot Table will match the total overall value.
Comments
0 comments