Interested in how content is being used or consumed by your customers? Our Content Insights page provides reporting on content usage and engagement, tied to Salesforce Opportunity data if available, to help content creators understand the impact of their work.
Overview
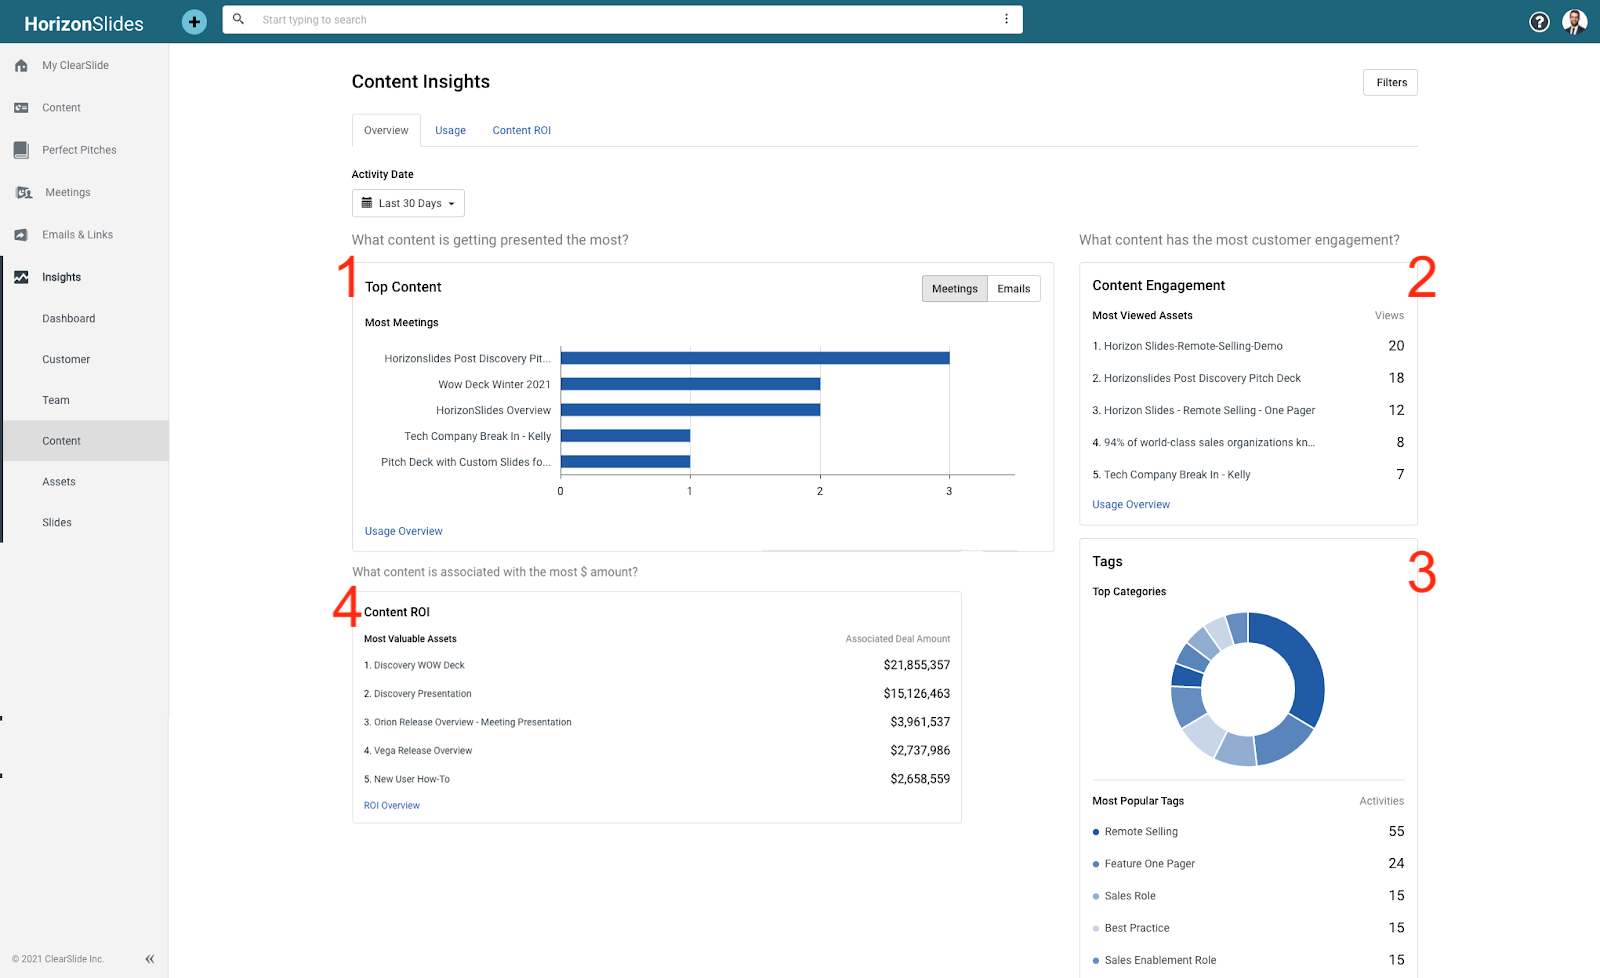
The Content Insights overview has widgets to help you understand content success at a glance. Use the “Activity Date” filter at the top to see how these metrics change over time.
- What are reps using? The “Top Content” widget lets you quickly identify the most used content in meetings or emails. Click on the document title to dive into page level interaction data.
- What’s most engaging? The “Content Engagement” widget lets you quickly identify the content most viewed by your customers across all meetings, emails or links. Click on the document title to dive into page level interaction data.
- What categories are trending? The “Top Tags” widget aggregates activities by tag applied to the content used so you can know which topics or themes are driving the most action. Click on the tag title to dive into recent usage of content with that tag.
- What content is driving revenue?The “Content ROI” widget highlights the assets used in communication with the highest value Opportunities. This widget is only available with our Salesforce integration.

Content Usage
Click over to the Usage tab for reporting that focuses on how content is being used by your team. Usage information lets you answer questions like:
- Which content is being used most? Can it be expanded to provide more value?
- Is a document being shared more in meetings or via email? How should this impact the content or format of the document?
- Which documents are NOT being shared? Should they be archived?
Use filters along the top to narrow usage reporting to a specific topic (tags), content team (content owner), user (used by) or Opportunity Stage (requires SFDC integration).
Top asset and popular tag widgets help you quickly identify top performing content based on your selected filters.
The graph shows top content usage by activity. Use the dropdown at the left to pivot between Meetings, Emails, and total Views.
The table shows all documents matching your filters and all usage metrics, including number of Presentations built with that asset and the total customer engagement time (minutes) across all activities. Click on the document title to dive into page level interaction data and review recent activities with that document.

Content ROI
Requires ClearSlide’s integration with Salesforce
Understand the impact of your content on your company’s revenue by seeing which SFDC Opportunities your content was shared with and the associated Opportunity value. Tying your content to the specific revenue it influenced allows you to understand:
- What content is impacting the highest revenue opportunities?
- Is content being created in the most impactful formats, topics, etc?
- Is there opportunity to justify additional resources for greater impact?
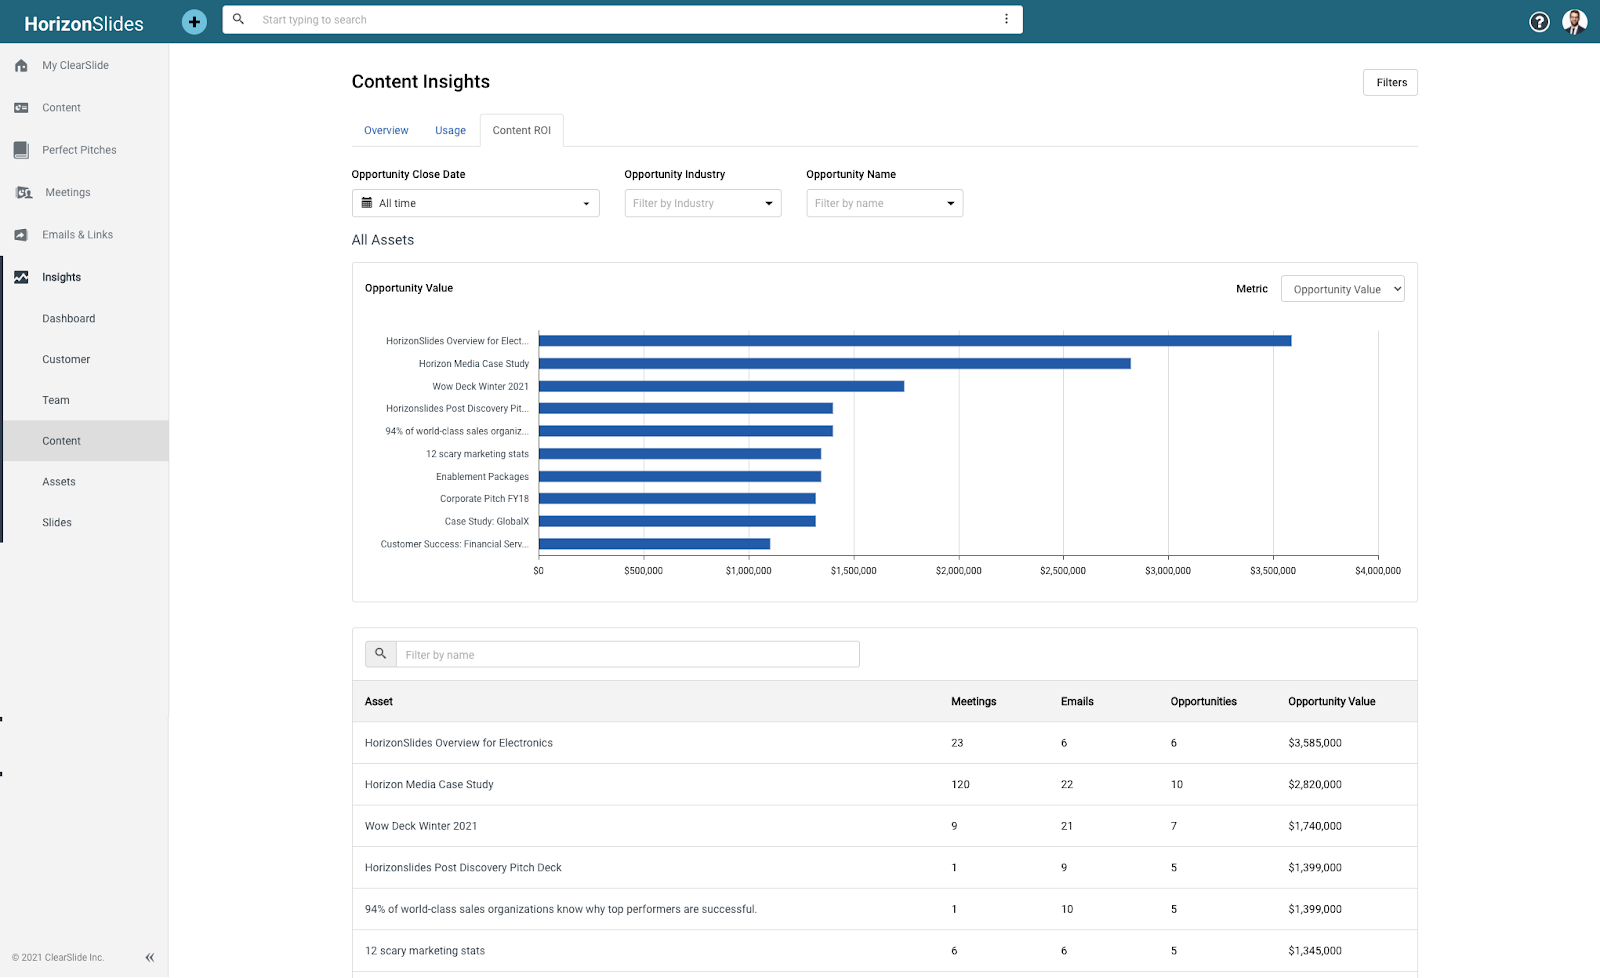
Filter by Opportunity close date, industry, or name to dive into a subset of interactions.
Use the table below to see how many activities occurred with each document, how many opportunities they were shared with, and the aggregated value of those opportunities.

Click on a document name to see the specific Opportunities the document was shared with and their individual value. Use the “Metrics” dropdown at the top right of the graph to pivot between Opportunity value and engagement metrics like Emails, Meetings and total Views.

Comments
0 comments